
No products in the cart.
Return To Shop


Data Science
Top 5 Python Libraries used for Data Visualization
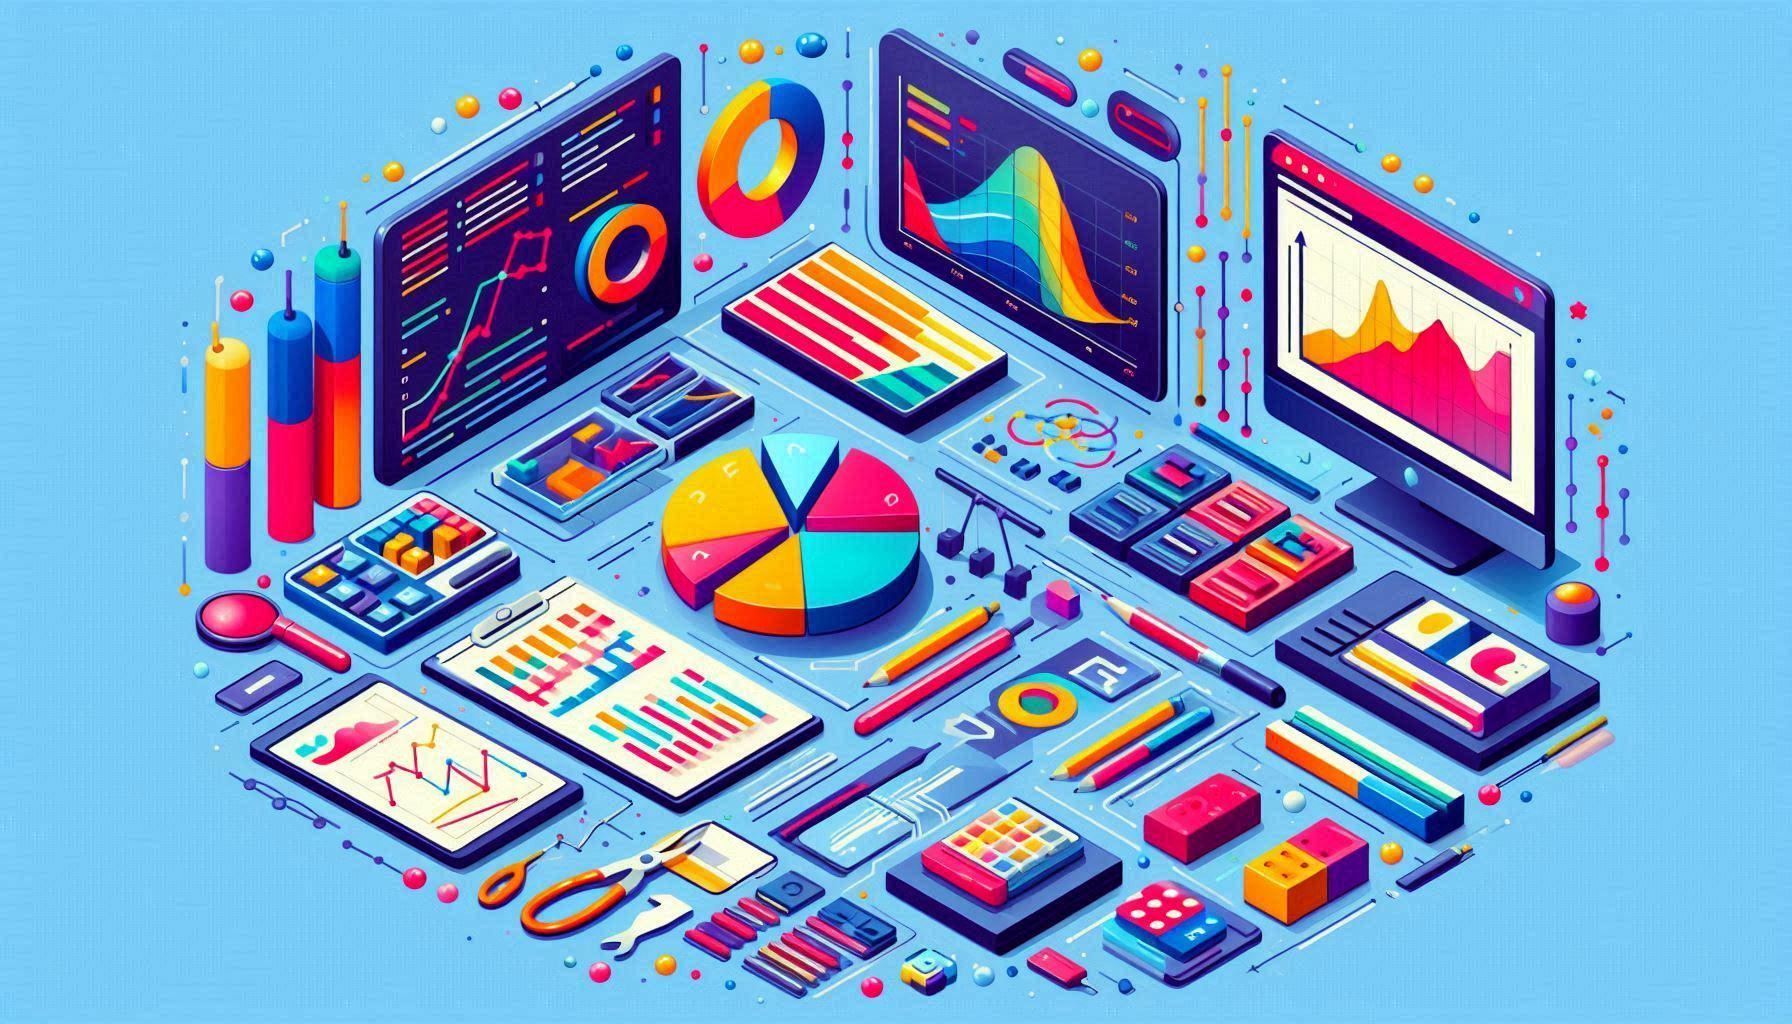
Data visualization is a critical component of data analysis, enabling swift comprehension of complex datasets. Python, with its array of libraries, offers a wealth of tools for crafting visually engaging and informative data visualizations. In this article, we’ll explore Top 5 Python Libraries used for Data Visualization, uncovering their functionalities, advantages, and real-world applications.
Matplotlib
Matplotlib is a versatile and foundational library for crafting static, interactive, and animated visualizations in Python. With its extensive range of plot types, including line plots, scatter plots, bar charts, and histograms, Matplotlib empowers users to visually explore their datasets. Its intuitive interface and seamless integration with popular Python libraries like NumPy and Pandas make it an ideal choice for both beginners and experienced data analysts.
Seaborn
Seaborn, built upon Matplotlib, offers a high-level interface for generating elegant and informative statistical graphics. It simplifies the creation of complex visualizations such as heatmaps, violin plots, and pair plots, making them accessible to users of all skill levels. Seaborn’s built-in support for data aggregation and statistical estimation facilitates the exploration of data relationships and patterns, while its modern default styles enhance the visual appeal of generated plots.
Plotly
Plotly is a robust library renowned for its ability to create interactive and web-based visualizations in Python. With a wide range of chart types and dynamic rendering capabilities, Plotly enables users to engage with their data interactively in web browsers. Its interactive features, including zooming, panning, and hovering over data points, enhance the exploration of underlying information. Additionally, Plotly’s APIs facilitate effortless embedding of visualizations in web applications, dashboards, and Jupyter notebooks, making it a preferred choice for building data-driven web solutions.
Bokeh
Bokeh specializes in crafting interactive visualizations with high-performance rendering, particularly suitable for large datasets. Unlike Plotly, Bokeh renders plots directly in HTML and JavaScript, ensuring portability and ease of sharing. With support for interactive features like linked brushing and hover tooltips, Bokeh facilitates the creation of engaging visualizations for in-depth exploration of complex datasets. Its seamless integration with Jupyter notebooks and Bokeh Server further enhances its utility for building interactive web applications.
Altair
Altair stands out as a declarative statistical visualization library, offering simplicity and expressiveness in visualization creation. By adhering to the Grammar of Graphics principles, Altair enables users to describe visualizations in terms of data transformations and mappings. Resulting in concise and expressive code. Its intuitive API generates Vega-Lite specifications, which are rendered into interactive visualizations using web-based frontends like Vega and Vega-Lite. With a focus on simplicity and composability, Altair empowers users to create intricate visualizations with minimal coding effort.
Conclusion
Winorbit Learning presents an extensive 12-month Data Science and Machine Learning Course. Meticulously crafted to equip participants with the requisite skills and expertise to excel in the dynamic realm of data science. This immersive program encompasses a broad spectrum of subjects, spanning from Python programming and data manipulation to exploratory data analysis. The Program also offers Top 5 Python Libraries used for Data Visualizations techniques using Matplotlib, Seaborn, Plotly, Bokeh, and Altair.
Throughout the curriculum, students will immerse themselves in practical learning experiences through hands-on projects and real-world case studies. These sessions enable learners to apply their newly acquired knowledge and skills to solve problems encountered in various industries. Moreover, personalized mentorship and guidance from seasoned industry professionals ensure that participants gain invaluable insights and perspectives into the intricacies of the data science domain.
Upon completion of the program, graduates emerge with a robust portfolio highlighting their proficiency in data science and machine learning. Armed with practical experience and industry-relevant skills, they are poised to embark on fulfilling careers in the burgeoning field of data science, which is currently in high demand across diverse sectors.
Data Science Course in Noida | Python Training Course in Noida | Machine Learning Course in Noida | Data Science Course in Delhi | Python Training Course in Delhi | Machine Learning Course in Delhi | Data Science Course in Gurugram | Python Training Course in Gurugram | Machine Learning Course in Gurugram | Data Science Online Course: Become a Data Scientist in 2024 | Python Online Training Course in India | Machine Learning Online Course in India